

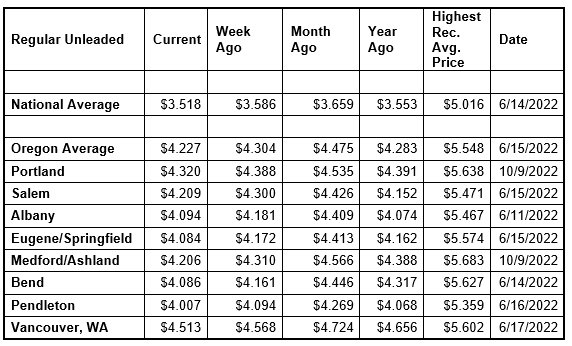
The national and Oregon averages for a gallon of regular gas have fallen to their lowest prices since March. The driving factors are lower crude oil prices, tepid demand for gas, and increasing gasoline supplies. But June 1 marked the start of the Atlantic hurricane season and forecasters predict it will be an active one. Any storm that impacts oil production and refining in the Gulf Coast has the potential to send pump prices higher. For the week, the national average for regular falls seven cents to $3.52. The Oregon average loses eight cents to $4.23 a gallon.
“Gas prices will likely continue to edge lower now that we’re between the Memorial Day and Independence Day holidays, barring unforeseen events. With two major ongoing geo-political events, the wars between Russia and Ukraine, and Israel and Hamas, crude oil prices could rise again. And we’re on weather watch – hurricanes and extreme heat have the potential to impact refinery output,” says Marie Dodds, public affairs director for AAA Oregon/Idaho.
The Oregon average began 2024 at $3.79 a gallon compared to $4.23 today. Its lowest price so far this year is $3.58 on February 14 and the highest is nearly $4.51 on May 1. The national average started the year at $3.11 and is at $3.52 today. Its lowest price so far this year is just under $3.07 on January 15 and the highest is just under $3.68 on April 19.
Gas prices always rise starting in late winter through the spring as refineries undergo maintenance as the switch to summer-blend fuel occurs. The switch occurs first in California, which is why pump prices on the West Coast often rise before other parts of the country. The East Coast is the last major market to make the change to summer-blend fuel. Most areas have a May 1 compliance date for refiners and terminals, while most gas stations have a June 1 deadline to switch to selling summer-blend until June 1. Switch-over dates are earlier in California with some areas in the state requiring summer-blend fuel by April 1. Some refineries will begin maintenance and the switchover as early as February.
Crude oil prices have remained volatile due to geopolitical events around the world including the war between Israel and Hamas, the war between Russia and Ukraine, and Houthi militant attacks in the Red Sea. In addition, production cuts by OPEC+ have tightened global crude oil supplies. OPEC+ met on June 2 and, as expected, the cartel will extend production cuts into the third quarter. This has sent crude prices slightly higher this week.
The price of crude oil reached the year-to-date high of nearly $87 per barrel on April 5 and has moved lower since then. West Texas Intermediate climbed above $80 on March 14 and above $85 on April 2, then dipped below $85 starting on April 17 and below $80 again on May 1. Major drivers of elevated crude prices are the unrest in the Middle East and the Ukrainian attacks on Russian refineries. Russia is a top global oil producer and the refinery attacks have reduced output.
Crude prices have been volatile after the attack on Israel by Hamas in October. While Israel and the Palestinian territory are not oil producers, concerns remain that the conflict could spread in the Middle East, which could potentially impact crude production in other oil-producing nations in the region.
Crude oil is trading around $73 today compared to $79 a week ago and $72 a year ago. In 2023, West Texas Intermediate ranged between $63 and $95 per barrel. Crude reached recent highs of $123.70 on March 8, 2022, shortly after the Russian invasion of Ukraine, and $122.11 per barrel on June 8, 2022. The all-time high for WTI crude oil is $147.27 in July 2008.
Crude oil is the main ingredient in gasoline and diesel, so pump prices are impacted by crude prices on the global markets. On average, about 56% of what we pay for in a gallon of gasoline is for the price of crude oil, 19% is refining, 10% distribution and marketing, and 15% are taxes, according to the U.S. Energy Information Administration.
Demand for gasoline in the U.S. fell slightly from 9.31 million b/d to 9.14 million b/d for the week ending May 24, according to the U.S. Energy Information Administration (EIA). This compares to 9.10 million b/d a year ago. Meanwhile, total domestic gasoline stocks rose from 226.8 to 228.8 million bbl.
Lower gasoline demand, increasing supply, and falling oil costs could lead to pump price decreases.
Quick stats
Oregon is one of 46 states and the District of Columbia with lower prices now than a week ago. Indiana (-18 cents) has the biggest weekly drop in the nation. Colorado (+4 cents) has the largest week-over-week increase. Oregon has the 11th-largest weekly decline.
California ($5.03) has the most expensive gas in the nation for the 14th week in a row and remains the only state in the nation with an average at or above $5 per gallon. Hawaii ($4.76) is second, Washington ($4.49) is third, Oregon ($4.23) is fourth, Nevada ($4.21) is fifth, Alaska ($4.16) is sixth. These are the six states with averages at or above $4 a gallon, down from seven states a week ago. This week 44 states and the District of Columbia have averages in the $3-range. No states have averages in the $2 range this week.
The cheapest gas in the nation is in Mississippi ($3.01) and Arkansas ($3.02) and. No state has had an average below $2 a gallon since January 7, 2021, when Mississippi and Texas were below that threshold.
The difference between the most expensive and least expensive states is $2.02 this week, compared to $2.08 a week ago.
Oregon is one of 49 states and the District of Columbia with lower prices now than a month ago. The national average is 14 cents less and the Oregon average is 25 cents less than a month ago. This is the fifth-largest month-over-month decline in the nation. Nevada (-34 cents) has the largest monthly drop. Colorado (+7 cents) is the only state with a month-over-month increase.
Oregon is one of 36 states with lower prices now than a year ago. The national average is four cents less and the Oregon average is six cents less than a year ago. Arizona (-66 cents) has the largest yearly decrease. Alaska (+19 cents) has the largest year-over-year increase.